Compared PARA (pixel-aligned heatmap) vs ACT (CLS-token regression) on out-of-distribution object position generalization in LIBERO task 0 (pick bowl, place on plate). PARA consistently outperforms ACT in low-data and extrapolation settings (82% vs 26% on left→right extrapolation). ACT catches up only with dense spatial coverage (32+ training positions). Both models use teleport servo evaluation with zero rotation.
Training Data
Generated a 16×16 grid of object positions (256 total trajectories) by shifting the pick bowl and place plate together across the workspace. dx: [-0.15, 0.0] m, dy: [-0.1, 0.1] m. Each trajectory uses natural-start servo replay: robot starts at home, interpolates to pre-grasp, then executes the shifted grasp/lift/place. Clean scene (distractors and furniture removed). 448×448 RGB, agentview camera, zero rotation. Dataset at /data/libero/ood_objpos_task0/.
Example: object position at grid corner (0,0)
Example: object position at grid center (8,0)
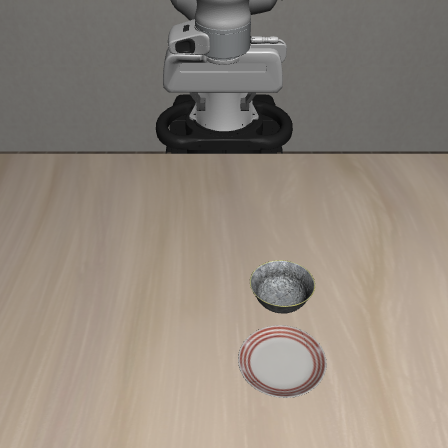
Example: object position at grid corner (15,15)
Test Setup
We ran 8 experiments testing different aspects of spatial generalization: • Exp 1 — Inner Square: Train on 4×4 center region (16 positions), test across full grid • Exp 2 — Random 10: Train on 10 randomly sampled positions, test across full grid • Exp 3 — Left→Right Extrapolation: Train on left half (128 positions), test on right half only • Exp 4 — Corner Scaling: Train on N={4,8,16,32,64} positions from corners/grid, test on fixed 20 positions All evals use teleport servo (closed-loop position control), zero rotation, clean scene, 600 max steps, 5 episodes per test position, 20 test positions per experiment.
Results
Main Results Table
| Experiment | Train demos | PARA | ACT | Winner |
|---|---|---|---|---|
| Inner square (center 4×4) | 16 | 65% | 19% | PARA (+46%) |
| Random 10 | 10 | 19% | 27% | ACT (+8%) |
| Left → Right extrapolation | 128 | 82% | 26% | PARA (+56%) |
| Corner scaling N=4 | 4 | 1% | 2% | Tie |
| Corner scaling N=8 | 8 | 46% | 19% | PARA (+27%) |
| Corner scaling N=16 | 16 | 51% | 11% | PARA (+40%) |
| Corner scaling N=32 | 36 | 59% | 66% | ACT (+7%) |
| Corner scaling N=64 | 64 | 54% | 52% | Tie |
Extrapolation Videos (Left → Right)
PARA trained on left half of position grid, evaluated on right half (unseen region). PARA succeeds consistently; ACT mostly fails.
PARA — Left→Right extrapolation (SUCCESS)
ACT — Left→Right extrapolation (FAILURE)
ACT — Left→Right extrapolation (rare SUCCESS)
Inner Square Videos (16 center positions)
Trained on 4×4 center region, tested across full grid. PARA generalizes outward; ACT fails outside the training cluster.
PARA — Inner square → full grid (SUCCESS)
ACT — Inner square → full grid (FAILURE)
N=16 Corner Scaling Videos
PARA — 16 corner positions (SUCCESS)
ACT — 16 corner positions (FAILURE)
N=32 Corner Scaling Videos
With 32+ training positions, ACT starts to work.
PARA — 32 positions (SUCCESS)
ACT — 32 positions (SUCCESS)
Analysis
Key findings: 1. PARA dominates in low-data regimes (N=8-16): 46-51% vs ACT's 11-19%. Pixel-aligned predictions are inherently position-invariant — the heatmap follows the object wherever it appears in the image. 2. PARA excels at extrapolation: 82% vs 26% when test positions are entirely outside the training region (left→right). ACT's global regression memorizes absolute coordinates and cannot extrapolate to unseen spatial regions. 3. ACT catches up with dense coverage (N=32+): With enough training positions to tile the workspace, ACT's direct 3D regression works comparably (59-66% vs 52-54%). 4. Both fail with 4 demos: Insufficient spatial coverage for either method. 5. ACT slightly wins with random sparse sampling (27% vs 19% at N=10). Random positions give better spatial coverage than a tight cluster for regression — the random samples span the workspace while the inner square is concentrated. Failure modes: PARA failures are typically gripper timing errors (bowl grasped but dropped during transport). ACT failures are systematic position errors (robot reaches to the wrong location entirely).
Next Steps & Concerns
Next steps: - Run viewpoint generalization experiments (dataset already generated: 5×5 viewpoints × 3 obj positions) - Test combined viewpoint + position OOD - Investigate whether PARA's gripper timing can be improved (main failure mode) - Try data augmentation (color jitter, spatial jitter) to improve data efficiency further Concerns: - Each experiment trains for only 10 minutes — longer training might change the picture for ACT - Test set has 20 positions with 5 episodes each — variance is high (some positions show 0% or 100%) - The teleport servo eval bypasses real controller dynamics — results may not transfer to real robot
Reproducibility
# Generate OOD object position dataset
python generate_ood_objpos.py --grid_size 16 --out_root /data/libero/ood_objpos_task0

# Create train/test splits
# (see run_experiments.sh for split creation code)

# Train (example: inner square experiment)
python train.py --model_type para --run_name para_exp1_inner \
  --cache_root /data/libero/ood_objpos_splits/exp1_inner_train \
  --batch_size 8 --lr 1e-4 --max_minutes 10 --skip_rotation

# Eval at a specific position
python eval.py --model_type para --checkpoint checkpoints/para_exp1_inner/best.pth \
  --teleport --zero_rotation --clean_scene --max_steps 600 \
  --shift_dx -0.039 --shift_dy -0.200 --n_episodes 5 --save_video