Compared PARA (pixel-aligned heatmap) vs ACT (CLS-token regression) on out-of-distribution generalization across object positions, camera viewpoints, and visual distractors. Both models use DINOv2 ViT-S/16 backbone, teleport servo evaluation, zero rotation, clean scene, 10 min training.
Summary Results
| Experiment | OOD Axis | PARA | ACT | Delta |
|---|---|---|---|---|
| Left → Right position extrapolation | Object position | 54% | 1% | +53% |
| Near → Far position extrapolation | Object position | 46% | 7% | +39% |
| Default → All viewpoints (zero-shot) | Camera viewpoint | 61% | 24% | +37% |
| Distractor robustness | Visual clutter | 60% | 40% | +20% |
Stage indicators in eval videos: ✔ PLACE = full success (green), ↑ GRASP = bowl lifted but not placed (yellow), ✘ MISS = didn't grasp (red).
Training Data
Object position dataset: 16×16 grid (256 trajectories) across a 39cm × 60cm workspace. Viewpoint dataset: 8×8 viewpoint grid (θ_max=25°) with random positions. Natural-start servo replay, clean scene, 448×448 RGB.
1. Left → Right Position Extrapolation (PARA 54% vs ACT 1%)
Train on left half of position grid (128 demos), test on right half. PARA's pixel-aligned heatmap follows the object. ACT's absolute coordinate regression cannot extrapolate.
Green = 128 training positions (left half). Blue = 20 test positions (right half).
PARA — 5×5 OOD test positions. Green = placed, yellow = grasped, red = missed.
ACT — same positions. Almost all red (miss).
2. Near → Far Position Extrapolation (PARA 46% vs ACT 7%)
Train on near half (closer to robot), test on far half. Tests depth-axis extrapolation.
Green = 128 training positions (near half). Blue = 20 test positions (far half).
PARA — 5×5 OOD test positions across the far half.
ACT — same positions. Mostly misses, some grasps but almost no placements.
3. Zero-Shot Viewpoint Generalization (PARA 61% vs ACT 24%)
Both models trained at the default camera viewpoint (θ=0°) with 64 diverse object positions. Evaluated across the full 8×8 viewpoint grid with random positions. PARA maintains ~62% through θ=17.9°. ACT collapses to 0% after θ=14°.
| θ | 0° (train) | 3.6° | 7.1° | 10.7° | 14.3° | 17.9° | 21.4° | 25° |
|---|---|---|---|---|---|---|---|---|
| PARA | 88% | 79% | 62% | 63% | 62% | 62% | 33% | 38% |
| ACT | 67% | 54% | 42% | 17% | 12% | 0% | 0% | 0% |
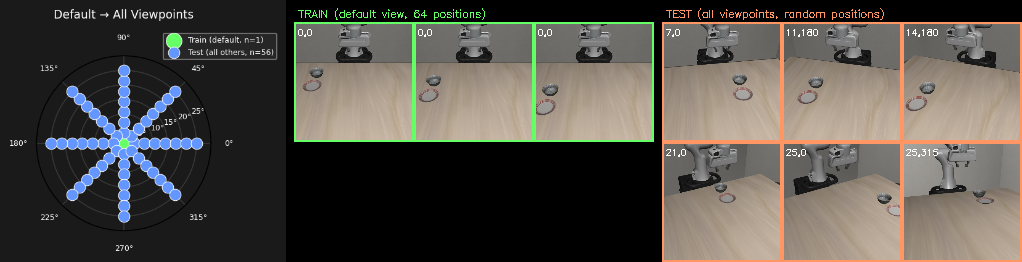
Polar plot: single green train dot at θ=0°, blue test dots across full 8×8 grid.
PARA — 5×5 viewpoint eval grid. Rows = θ, columns = φ.
ACT — same viewpoint grid. Mostly failures at non-default viewpoints.
4. Distractor Robustness (PARA 60% vs ACT 40%)
Models trained on clean scenes (N=64 positions), tested at default LIBERO position with distractor objects and furniture present.
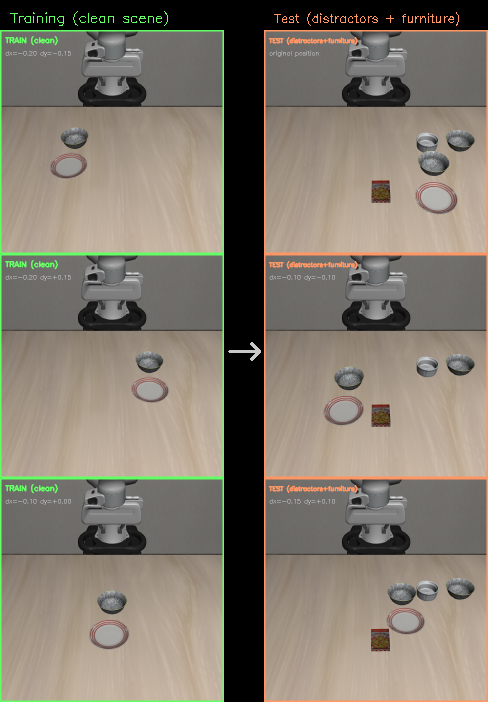
Left: clean training scenes. Right: cluttered test scenes with distractors and furniture.
PARA — default position with distractors + furniture
ACT — same scene with distractors
Analysis
PARA's pixel-aligned formulation provides three key advantages: 1. Position extrapolation: PARA's heatmap follows the object wherever it appears (54% vs 1% left→right, 46% vs 7% near→far). ACT memorizes absolute coordinates and cannot extrapolate. 2. Viewpoint robustness: PARA predicts in image space then recovers 3D via camera geometry. When the camera moves, the heatmap shifts with the visual appearance (61% vs 24% zero-shot, ACT drops to 0% at θ>14°). 3. Distractor robustness: PARA's local pixel predictions are less disrupted by irrelevant visual clutter (60% vs 40%). ACT's advantage: with full coverage (all positions/viewpoints in training), ACT matches or exceeds PARA — global regression is effective when training covers the test distribution.
5. Point Track Pretraining (Circle → Robot Transfer)
Can PARA be pretrained from 2D point tracking alone — no robot, no 3D, no gripper — and transfer to real robot scenes? We pretrain PARA with N_HEIGHT_BINS=1 (2D heatmap only) on scenes where the robot is completely hidden and replaced with a colored circle at the EEF position. The model learns to predict where the circle will move. Then we test: does this pretrained model produce meaningful heatmaps when shown a real robot scene it has never seen?
Training Data: Circle Overlay (No Robot)
All robot geoms hidden. An orange circle is drawn at the projected EEF pixel. 256 demos across the full position grid. The model only sees: table + objects + moving circle.
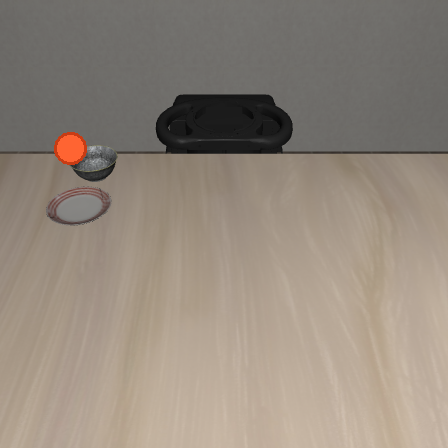
Sample training frame: orange circle marks EEF position. No robot visible at all.
Cross-Domain Heatmap Transfer
The circle-pretrained model evaluated on both training scenes (circle overlay) and unseen robot scenes (zero-shot). Top 3 rows: circle scenes (training distribution). Bottom 3 rows: real robot scenes (never seen during training). Each row shows: input + start keypoint (green dot) → predicted heatmaps for t+1 through t+4.
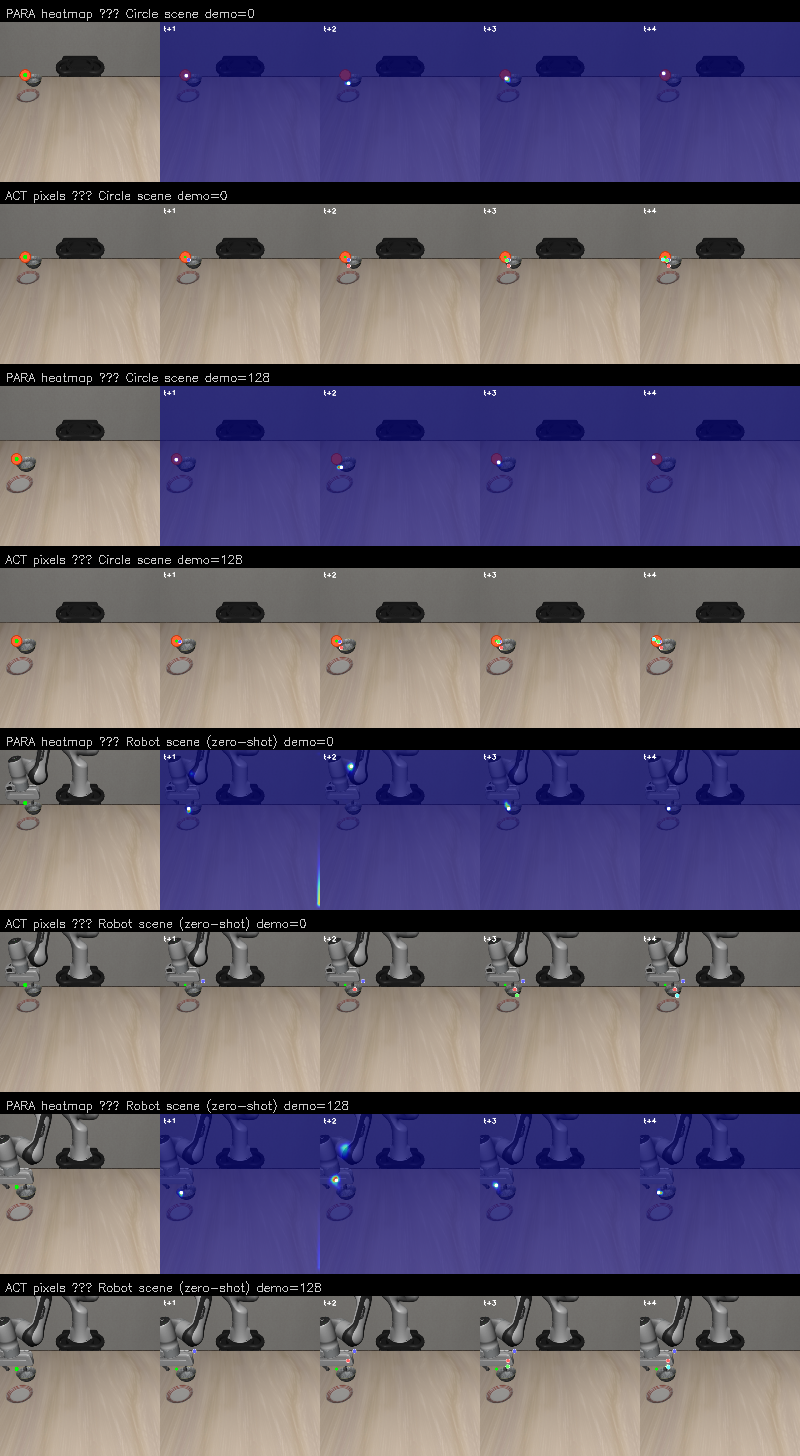
Circle-pretrained models evaluated on circle scenes (top half) and robot scenes (bottom half, zero-shot). PARA (heatmap rows): sharp spatial predictions on circles, diffuse but meaningful on robots. ACT (pixel dots rows): predicts trajectory points on circles, less coherent on robots. Each row shows input + 4 future timestep predictions.
Fine-tuning Results: 2D Pretraining (Heatmap Only)
After pretraining on 256 circle-overlay demos with 2D heatmap objective only (no height bins, no gripper), fine-tune on real robot demos. The pretrained backbone provides a 4× improvement over training from scratch in the low-data regime.
| Demos | PARA 2D-pt | PARA scratch | ACT 2D-pt | ACT scratch |
|---|---|---|---|---|
| 1 | 10% | 0% | 0% | 0% |
| 3 | 20% | 7% | 0% | 0% |
| 5 | 33% | 7% | 0% | 0% |
| 10 | 39% | 10% | 18% | 6% |
| 20 | 31% | 29% | 24% | 44% |
| 256 | 83% (upper bound) | — | ||
PARA 2D-pretrained dominates in the very low-data regime (1-5 demos): 10-33% success while everything else gets 0-7%. The 2D heatmap pretraining objective transfers directly to the 2D component of the volume head, so the model only needs to learn height prediction from robot data.
Fine-tuning Results: 3D Pretraining (Full Model)
Can we do better by pretraining with the full 3D objective (same architecture, same heads, same losses — only the visual input differs)? We pretrain PARA and ACT on circle-overlay data with full 3D supervision (volume + height + gripper for PARA, position + gripper for ACT), then fine-tune on real robot demos. This gives direct weight transfer — every layer is initialized from pretraining.
| Demos | PARA 3D-pt | PARA 2D-pt | PARA scratch | ACT 3D-pt | ACT 2D-pt | ACT scratch |
|---|---|---|---|---|---|---|
| 1 | 0% | 10% | 0% | 0% | 0% | 0% |
| 3 | 0% | 20% | 7% | 0% | 0% | 0% |
| 5 | 21% | 33% | 7% | 0% | 0% | 0% |
| 10 | 66% | 39% | 10% | 21% | 18% | 6% |
| 20 | 64% | 31% | 29% | 72% | 24% | 44% |
| 256 | 83% (upper bound) | — | ||||
| Demos | PARA 2D-pt | PARA 3D-pt | ACT 2D-pt | ACT 3D-pt | ||||||||
|---|---|---|---|---|---|---|---|---|---|---|---|---|
| P | G | Wtd | P | G | Wtd | P | G | Wtd | P | G | Wtd | |
| 1 | 3 | 18 | 12% | 0 | 0 | 0% | 0 | 0 | 0% | 0 | 0 | 0% |
| 3 | 5 | 3 | 6% | 0 | 3 | 2% | 1 | 7 | 4% | 0 | 0 | 0% |
| 5 | 15 | 41 | 36% | 21 | 42 | 42% | 2 | 3 | 4% | 0 | 0 | 0% |
| 10 | 3 | 62 | 34% | 66 | 3 | 68% | 24 | 31 | 40% | 21 | 16 | 29% |
| 20 | 39 | 27 | 52% | 64 | 1 | 64% | 50 | 32 | 66% | 72 | 9 | 76% |
Two pretraining regimes emerge:
1. Very low data (1-3 demos): 2D pretraining wins. PARA 2D-pt grasps with just 1 demo (18 grasps, 12% weighted) while 3D-pt gets 0%. The simpler heatmap-only objective transfers more easily — the model only needs to learn height prediction from the few robot demos.
2. Moderate data (5-20 demos): 3D pretraining dominates. PARA 3D-pt reaches 68% weighted at 10 demos vs 34% for 2D-pt. ACT 3D-pt reaches 76% weighted at 20 demos — the best overall result.
The crossover is at 5 demos (PARA 3D-pt 42% vs 2D-pt 36% weighted).
Critical insight — 3D pretraining converts grasps into placements: At 10 demos, PARA 2D-pt grasps 65% of the time (3 places + 62 grasps) but almost never completes placement (3% binary). PARA 3D-pt grasps at a similar rate (69%) but converts nearly all grasps to full placements (66% binary). The 3D pretraining teaches the height/placement skills that 2D pretraining leaves to be learned from scratch. This is the key benefit: both pretraining methods learn the 2D spatial reasoning needed to reach the object, but only 3D pretraining provides the depth and gripper skills needed to complete the manipulation.